Receipts.
Paper ones curled like dried leaves at the bottom of a coat pocket, ink fading on thermal strips that turn grey if you leave them too close to a radiator or a sunny windowsill, and digital ones sitting quietly in an inbox folder named "Taxes or Regret." If you keep enough of them across enough months, you start to notice something strange about money. It rarely vanishes in a dramatic heist. Usually, it leaks through a seam so thin you cannot hear the hiss until your shoes feel tighter at the toe and your winter coat suddenly seems shorter in the sleeves. Also making waves in this space: Why Netflix Laying Off 6 Percent of Its Workforce Is About Discipline Not Panic.
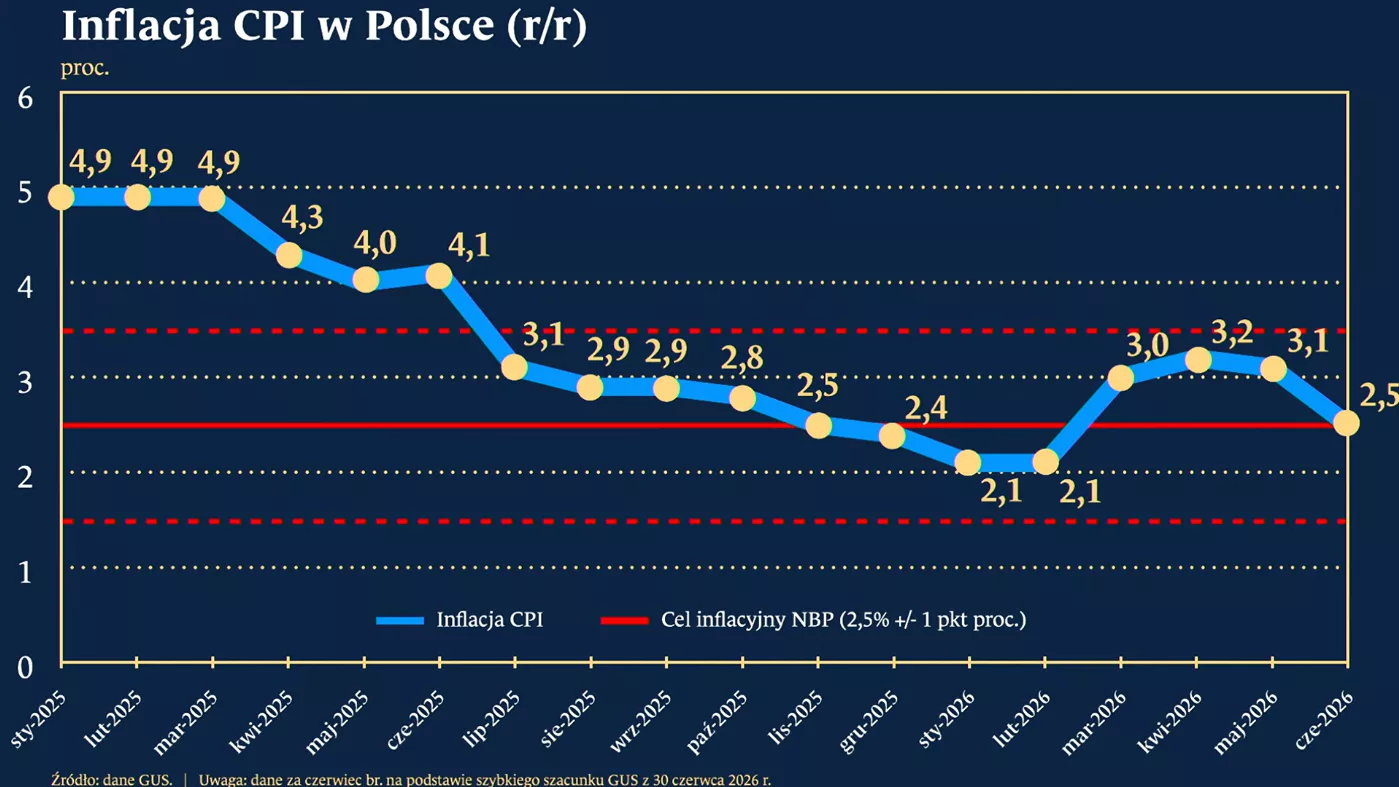
I used to think inflation was a weather report from another planet. A number read aloud on a morning broadcast by someone wearing a blazer with sharp shoulders, followed by a graphic showing a line drifting gently upward like smoke from a chimney in a painting. Core CPI. Headline rate. Month-over-month. Year-over-year. Words that sounded like abbreviations for municipal zoning laws or obscure European railways. You nodded, took another sip of coffee, and moved on to whether your train was delayed.
Then came the grocery run where olive oil cost enough to make you pause with your hand on the glass bottle, calculating how many roasted potatoes you could get out of it before Friday. Then came the utility bill that arrived in early autumn—a month when you hadn't even turned the furnace on properly yet—asking for more than you remembered paying in the dead of January. That is the moment a chart stops being a chart and becomes a room you have to walk through in the dark. Further details into this topic are covered by The Economist.
When a headline promises the September inflation breakdown in a single chart, it offers a tidy bird's-eye view. A single chart is honest in its way; it compresses thousands of shop counters, delivery vans, gas meters, dental appointments, and rent renewals into neat bars or points. Yet a single chart has a blind spot the size of a human life. It cannot tell you which bar belongs to the person who drives forty miles to a warehouse shift and which bar belongs to the household that can swap chicken thighs for lentils without changing its postal code.
To see what a September inflation snapshot really does, we have to look past the aggregate line and trace how prices move at different speeds through different parts of daily existence. Because inflation is never a single tide lifting every boat evenly. It is more like water moving through an old house with uneven floorboards: one corner stays dry for weeks, while another swells and warps overnight.
The Cart That Refuses to Stay Light
Picture a hypothetical household—let's call them Maya and Tariq, living in a two-bedroom apartment in a mid-sized city, splitting a budget that looked comfortable two autumns ago and now feels stretched taut like a drumhead. Nothing catastrophic happened to them. No layoff, no medical emergency, no sudden collapse in income. Their story is quieter and, for that reason, harder to argue with at the end of the month.
One Tuesday evening in late September, Maya stands in front of a supermarket shelf holding two cartons of eggs and a bag of oats. She isn't doing advanced macroeconomics in the fluorescent aisle. She is doing the quiet, relentless math every household knows by heart: if I put this in the basket, what leaves the basket?
Food inflation has a peculiar emotional weight because eating is non-negotiable. You can postpone buying a winter jacket for three weeks if your old one still zips; you cannot postpone dinner until next pay cycle without feeling it in your ribs. In September data, food categories often reveal a tug-of-war between farm-level shifts, transport costs, seasonal supply, and retail pricing power. A modest percentage increase across groceries sounds small when spoken quickly—"up a couple of tenths" or "running around two to three percent annually"—until you multiply it by fifty-two weeks of lunches, school snacks, coffee grounds, and cooking oil.
Consider what happens next when food prices creep up alongside everyday essentials: people adapt in micro-steps. They buy the store brand. They skip the berries that look slightly soft in the corner of the clamshell. They bake bread instead of grabbing a loaf on the way home. None of those choices makes the evening news. All of them represent a tax on convenience and variety—the small cushions that make an ordinary Tuesday feel generous rather than rationed.
I have stood in that exact aisle, holding a jar of peanut butter and mentally converting ounces into cost-per-serving while pretending I was just looking for the natural kind without palm oil. There is a subtle embarrassment that creeps in when you start putting items back—not dramatic shame, just a tight little knot in your chest that reminds you how thin the margin between "fine" and "tight" can be. If you have ever felt that knot, you already understand more about consumer price indexes than half the people debating basis points on television.
Shelter, Energy, and the Bills That Don't Ask Permission
Groceries are loud because you touch them every week. Housing and energy are quieter, heavier, and harder to dodge.
Think of housing costs—rent and owner-equivalent shelter—as the foundation of a house. Even when the roof tiles stop rattling, a shift in the foundation changes the angle of every door frame inside. In inflation breakdowns, shelter tends to move with a lag. Leases don't reset every Tuesday; rents renew once a year, mortgages sit fixed or adjust on schedules, and property taxes or maintenance expenses trickle into monthly figures over time. When September's numbers show shelter cooling slightly or holding stubbornly elevated, that lag is doing its quiet work in the background. A headline deceleration in a monthly reading does not mean last year's rent hikes have evaporated from a tenant's checking account. It often just means the speed of new increases is slowing down from a sprint to a brisk walk.
Energy is the opposite of shelter: restless, jumpy, tethered to global supply chains, refinery maintenance, weather systems, and geopolitical nerves. A warm or cool September changes how much air conditioning or early heating people use; crude oil swings ripple into gasoline at the pump; electricity tariffs reflect fuel mixes and grid upgrades. When energy prices dip in a given month, they can pull headline inflation down and give commuters a brief sigh of relief at the filling station. When they rebound, they push right back into freight and household bills.
Here is a metaphor to keep the distinction clear: imagine your monthly expenses as a choir. Headline inflation is the overall volume of the room when every singer is humming at once. Core inflation steps outside the room to listen without the two loudest, most erratic soloists—food and energy—so analysts can hear whether the rest of the choir is holding pitch.
That distinction is genuinely useful, not a trick to hide expensive groceries. Economists strip out food and energy in "core" measures because sudden weather shocks or oil spikes can distort the underlying trend in either direction. Yet living inside the room means you don't get to mute the soloists. If electricity and milk both rise in September while furniture stays flat, your wallet experiences the whole choir, not the edited recording.
Why "Cooling" Doesn't Always Feel Like Relief
One of the hardest things to explain—and one of the easiest things to misunderstand when reading a September inflation chart—is the difference between disinflation and deflation.
Disinflation.
Say it slowly and it sounds like a medical procedure, yet it describes the exact relief many people are hoping for when they hear inflation is "moderating" or "easing." Disinflation means prices are still rising, just more slowly than they used to. If a cup of coffee went from $3.00 to $3.30 last year and moves from $3.30 to $3.38 this year, inflation has slowed down. The rate dropped. The price did not go back to $3.00.
Deflation is when the overall price level actually falls—when that $3.38 cup goes back toward $3.00. It sounds tempting on paper until you remember why broad deflation is rare and often dangerous in modern economies: when prices fall across the board for long stretches, buyers wait for lower prices tomorrow, companies earn less revenue, hiring slows, and wages come under pressure. Nobody wants a bargain that arrives alongside a shrinking paycheck.
Let's return to Maya and Tariq for a moment—still our hypothetical couple, still grounded in real-world arithmetic. Suppose their combined take-home pay rose by two percent this year, while their core living costs rose by two and a half percent after two prior years of steeper climbs. Even if September's monthly print looks calm on a chart, their purchasing power is still catching its breath. They aren't imagining the squeeze; they are living the cumulative effect of stacked price levels.
History backs this up. After sharp bursts of inflation—whether in the 1970s or in the post-pandemic surge of the early 2020s—there is almost always a frustrating middle chapter. Policymakers and analysts celebrate that the fever has broken and growth is stabilizing, while households look at their bank statements and ask why everything still feels so expensive. Both statements can be true at once. A fever breaking means you are no longer climbing toward 104 degrees; it does not mean you are back to your normal energy before the illness started.
The Invisible Stakes Behind Every Category
A single chart for September 2026 forces tough choices about compression. To fit an entire month's price movements into one visual, you have to group hundreds of distinct items into buckets: housing, food at home, food away from home, energy commodities, energy services, medical care, transportation, apparel, recreation.
Every one of those buckets hides human trade-offs that statistics alone flatten.
Take healthcare or auto insurance and repair—categories that frequently tug at household budgets even when headline numbers look tame. When car insurance premiums climb because repair parts cost more, sensors in bumpers are pricier to replace, and labor rates are higher, a driver doesn't see "transportation services" on a ledger. They see an automatic withdrawal that leaves less room for savings or weekend travel. Or consider dining out versus cooking at home: when restaurant prices rise faster than supermarket staples, eating out shifts from a casual habit to a planned occasion. That changes local cafes, servers' tip pools, and the small social rituals that glue neighborhoods together.
Then there is the quiet divide in how inflation is felt. Economists sometimes talk about a "personal inflation rate" because no two households buy the exact basket of goods weighted in an official index. A retiree on a fixed income who spends a larger share on healthcare and utilities experiences price shifts differently from a young renter spending heavily on housing and groceries, or a family with two school-aged children buying shoes every few months. An official index is a mirror held up to an average; your own life is a mirror held up to your own receipts.
I admit something freely here: sometimes even people who read economic reports for a living get tripped up by seasonal adjustments, base effects, and revision noise. A number can look startling because of what happened twelve months earlier—a "base effect" where a high or low month drops out of the annual comparison—rather than a sudden lurch in September itself. When a chart looks dramatic, it is always worth asking whether the cliff is steep right now or whether we are just comparing today's ledge to a valley a year ago.
Reading the Chart Without Losing the Plot
If you look at a September inflation breakdown—whether it is a bar chart of major components, a line of monthly changes, or a comparison of headline versus core—you don't need an economics degree to read it well. You just need three questions in your back pocket before you decide what the number means for you.
First: Is this a monthly pulse or an annual story? A single month can be noisy—jumpy due to airfares, lodging, or a spike in fuel—while the twelve-month figure smooths out some of that bounce but carries older history along with it. Looking at both keeps you from overreacting to one windy afternoon or ignoring a steady crosswind.
Second: Which buckets are doing the pushing? Are prices moving mainly because of volatile items like fuel and seasonal food, or because of sticky, broad-based services like rent, insurance, and personal care? Sticky services tend to linger longer in family budgets and shape how central banks think about interest rates and borrowing costs.
Third: How does this compare to my own fixed commitments? Interest rates on credit cards, auto loans, and savings accounts all live in the same financial ecosystem as inflation. When inflation stays above target or cools unevenly, borrowing money stays costlier for longer, making high-interest debt heavier to carry while cash in a low-yield account quietly loses a fraction of its buying power each year.
None of this is magic, and none of it requires panicking over every decimal point. Financial literacy at its best isn't about predicting every twist of the market with oracle precision. It is about seeing the mechanics clearly enough that you stop blaming yourself for every pinch—and start making deliberate choices where you actually have leverage.
What Remains After the Numbers Fade
Charts get archived. Next month's report arrives, pushes September's bars slightly to the left, and gives commentators a fresh set of adjectives to argue over until November and December take their turn. By next spring, September 2026 will be a dot on a longer curve, remembered only by those who were paying close attention or trying to close a gap in a spreadsheet.
Yet the human record of that month lives somewhere much more ordinary. It lives in the way Maya checks the unit price tag along the bottom edge of the shelf before reaching up. It lives in Tariq deciding whether to fix the leaking faucet washer himself on a Saturday morning instead of calling a plumber. It lives in a kitchen drawer where a folded paper receipt still holds the exact price of milk, bread, and a quiet evening at home.
Numbers measure what happened to the price of things. Only we decide what matters most when the price of living asks us to choose.